Target Polarization Switch Time

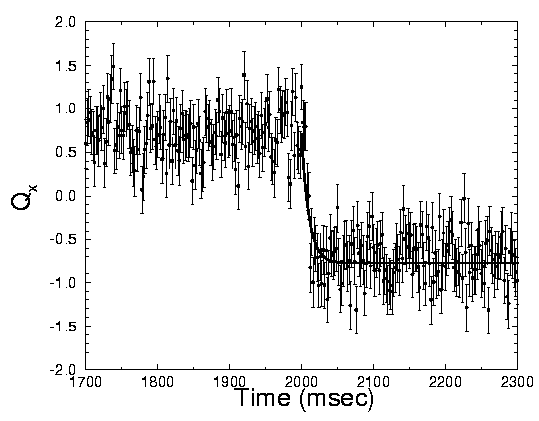
The plot shows the target polarization along the X axis as a function
of time. The horizontal axis is time in milliseconds and the plot
shows a single transition of the target polarization from the +X to
the -X direction. The complete switch occurs in approximately 50
milliseconds.
Last modified: Mon May 13 8:09 PM 1996


